



The Meridian The Rentier Trap · Borrowed Prosperity & Structural Failure · September 2026
15 Articles · The Rentier Trap · September 2026
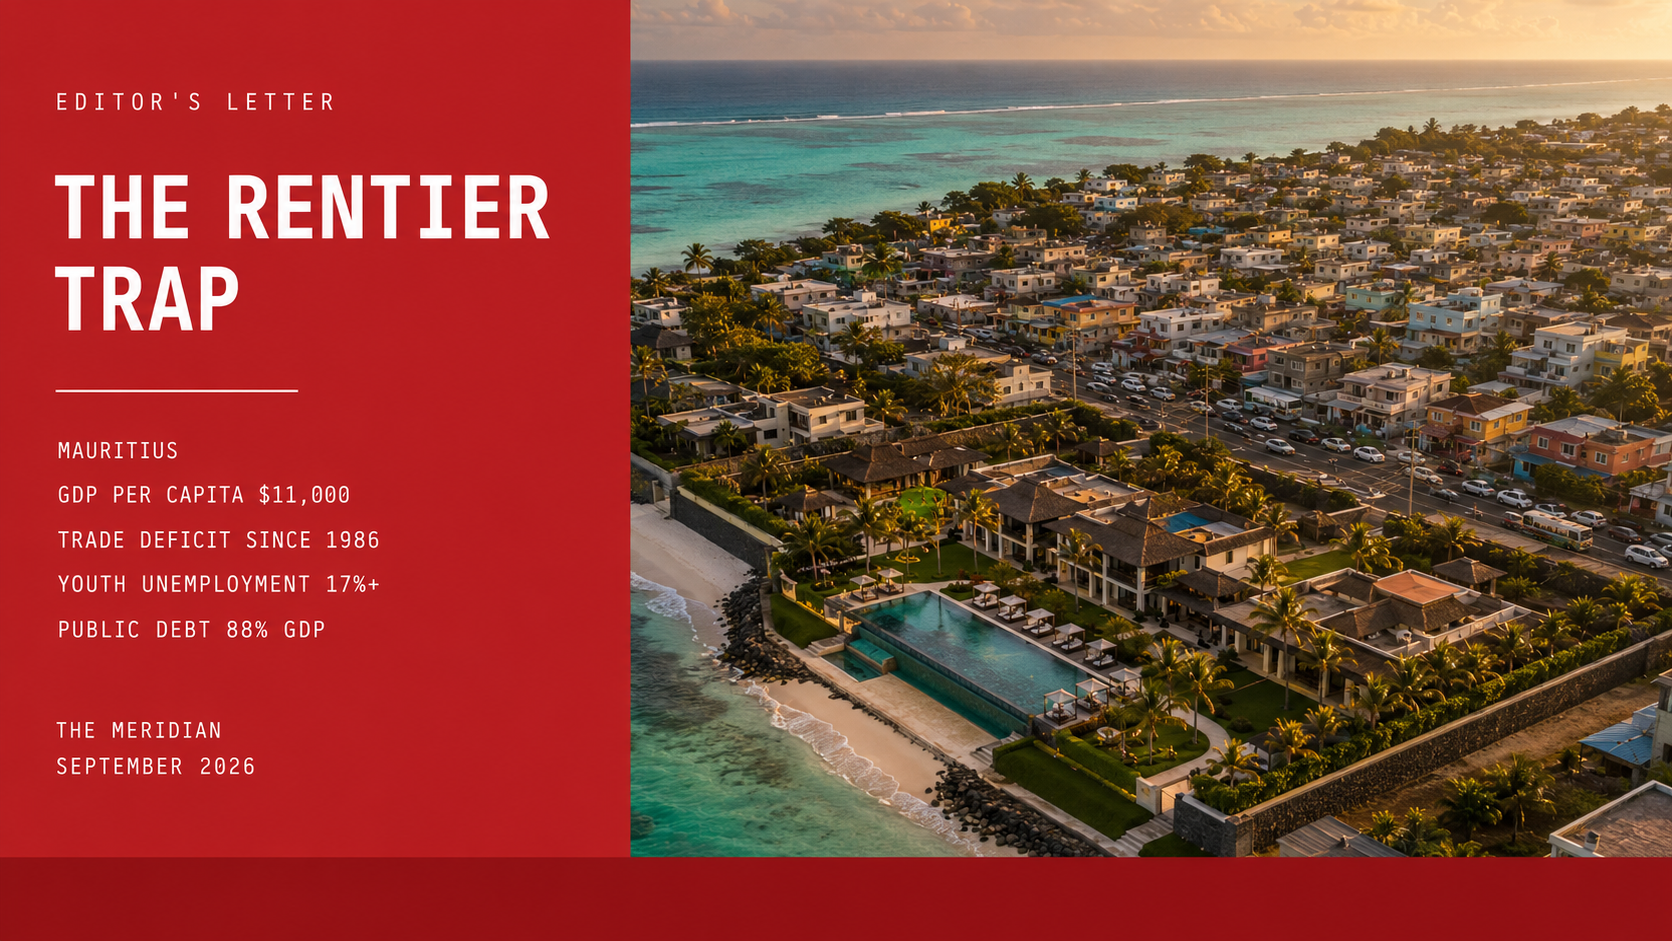
The Rentier Trap Editor's Letter September 2026 The Meridian Vayu Putra
● Editor's LetterEditor's Letter · Start Here · September 2026

The Rentier Trap: How Mauritius Borrowed Its Way to Prosperity and Is Now Paying the Price

Three sequential rent transitions built Mauritius's prosperity. Each delivered real wealth. Each deepened the dependency it was supposed to cure. Vayu Putra opens the September 2026 edition.

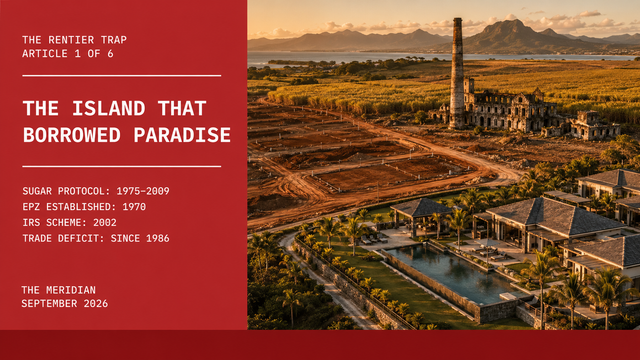
The Island That Borrowed Paradise Mauritius Economic History The Meridian September 2026
● Lead AnalysisThe Rentier Trap · Article 1 of 15 · September 2026

The Island That Borrowed Paradise

Three sequential rent transitions built Mauritius's prosperity: textiles, then tourism, then offshore finance. Each was real. Each left the island more dependent on external conditions it could not control. The structural history of a celebrated development model and the trap its own success created.

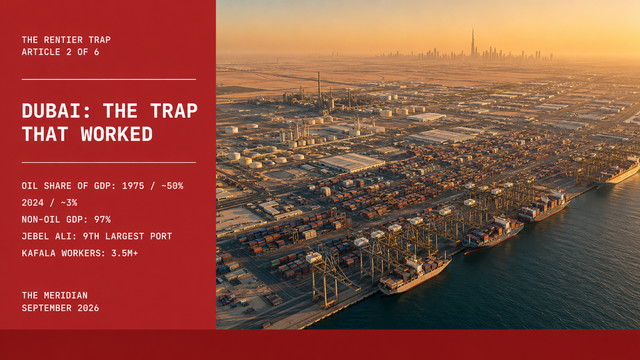
Dubai The Trap That Worked UAE Rentier Economy The Meridian September 2026
● NewComparative Case: UAE · Article 2 of 15 · September 2026

Dubai: The Trap That Worked

Oil revenue financed a deliberate structural transformation before the resource ran out. Logistics, finance, and tourism infrastructure built with resource rents before they expired. The model transferred rents into productive capital. Costly, authoritarian, and largely unrepeatable. The success case examined.

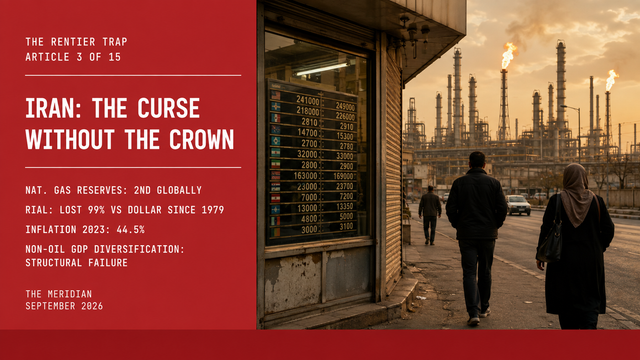
Iran The Curse Without the Crown The Meridian September 2026
● NewComparative Case: Iran · Article 3 of 15 · September 2026

Iran: The Curse Without the Crown

Hydrocarbon rents concentrated without productive conversion. Sanctions accelerated a structural failure that predated them. Currency collapsed. Inflation embedded. The economy runs on parallel market mechanisms that substitute for the formal economy. The trap closed.

The Import Dependency Trap Mauritius The Meridian September 2026
● NewStructural Analysis · Article 4 of 15 · September 2026

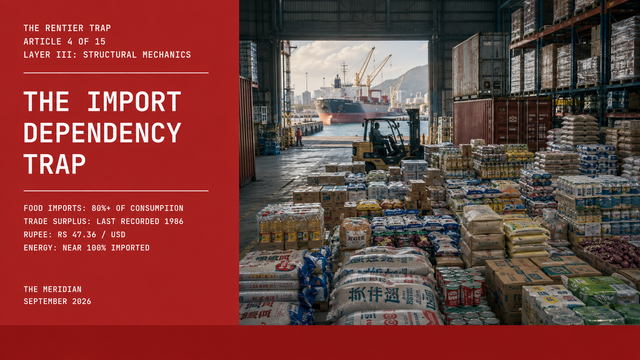
The Import Dependency Trap

80 per cent of food imported. Nearly all energy. Rupee depreciation raises the cost of living directly, without the export stimulus it is supposed to deliver. The central bank cannot cure what import dependency has structurally embedded.

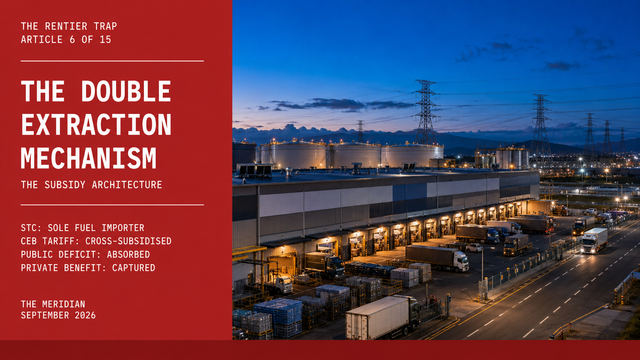
The Double Extraction Mechanism Mauritius The Meridian September 2026
● NewAnalytical Framework · Article 5 of 15 · September 2026

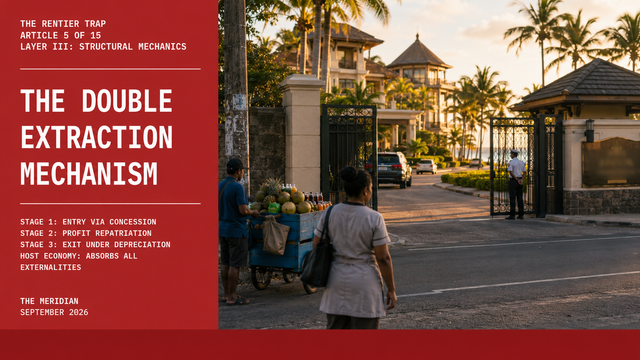
The Double Extraction Mechanism

Rs 152 billion in foreign real estate since 2006. Mauritian buyers: 9%. Property up 80%, wages up 20%. Entry via concession. Operation via profit repatriation. Exit under rupee depreciation. Three stages. One mechanism. Five decades of operation.

Youth Without a Future Mauritius Youth Unemployment The Meridian September 2026
● NewSocial Economy · Article 6 of 15 · September 2026

Youth Without a Future

Youth unemployment 17.37%. 63,000 foreign workers employed simultaneously. 74% of ages 18-24 have considered emigrating. The economy imports workers for the roles it cannot fill and exports graduates for the roles it has not built. The structural mechanism examined.

The Name That Was Taken Editorial September 2026 The Meridian
● NewEditorial · Mauritius · Article 7 of 15 · September 2026

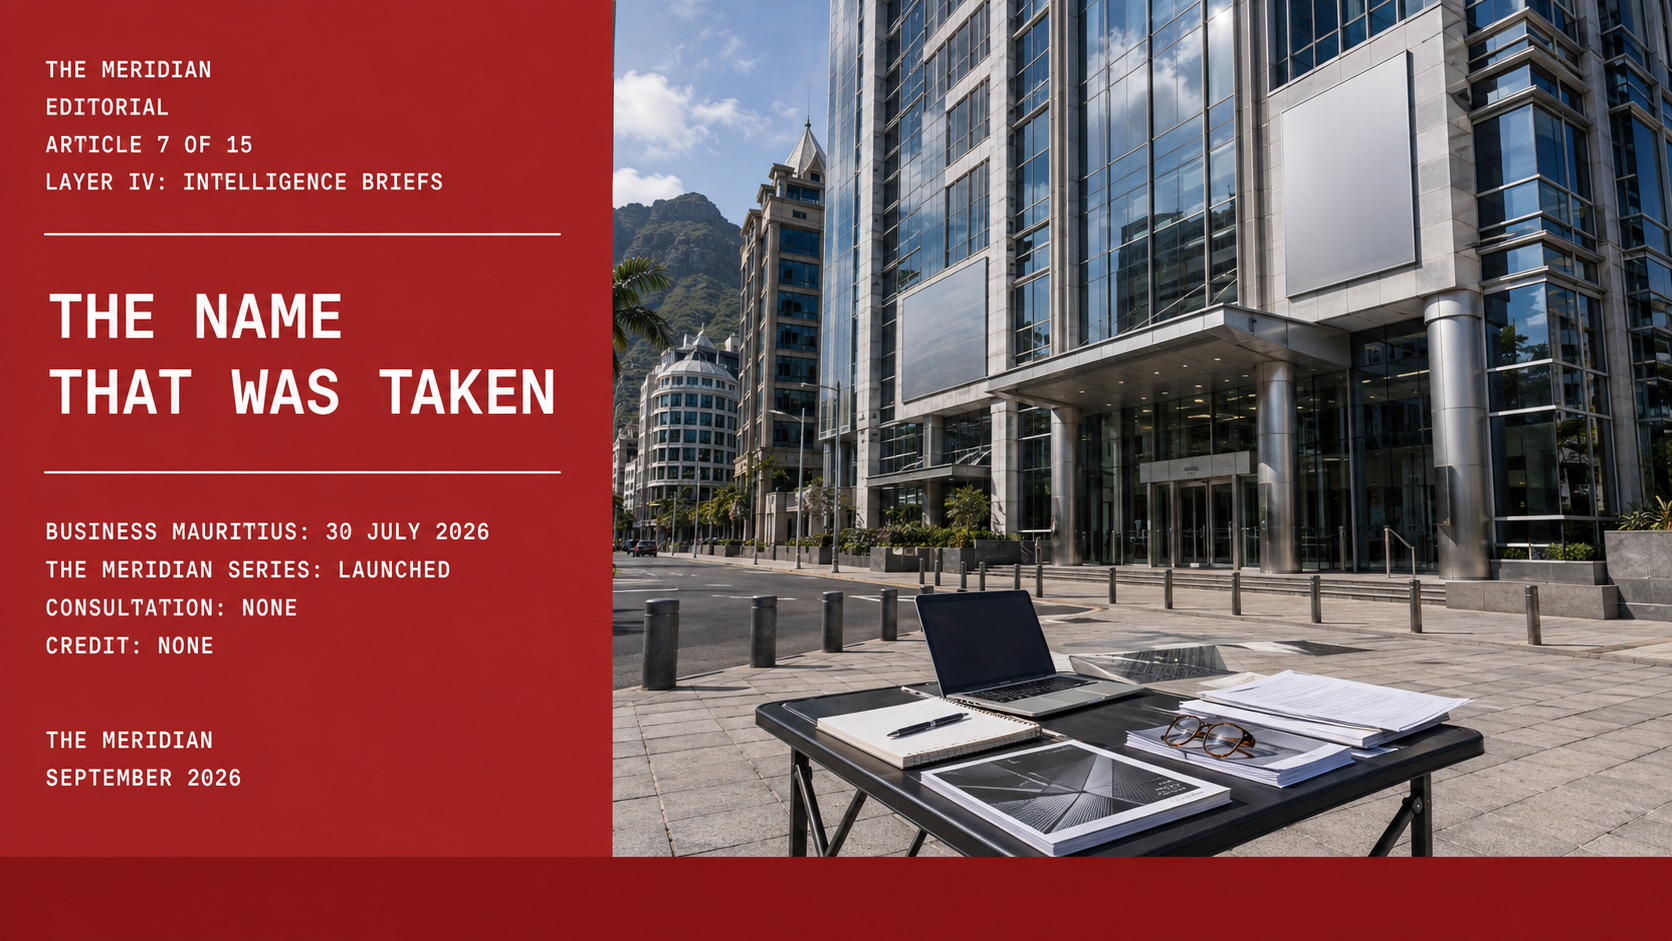
The Meridian and the Name That Was Taken

On 30 July 2026, Business Mauritius launched a networking series and named it The Meridian. No consultation. No credit. The act is a structural condition made visible. Independent intellectual work in a concentrated economy is a resource available for use without acknowledgement.

Russia Demographic Fracture Global Supply Chain September 2026 The Meridian
● NewIntelligence Brief · Russia · Article 8 of 15 · September 2026

Russia Is Running Out of Workers. The World Is Paying for It.

GDP contracted 1.5% in Q1 2026. 2.6 million workers short. Defence at 40.5% of the federal budget. Central Asia as the backdoor. Fertiliser chain disrupted. The Russian war economy is a Global South supply chain event.

The Double Extraction Mechanism The Subsidy Architecture The Meridian September 2026
● NewThe Subsidy Architecture · Article 6 of 15 · September 2026

Mauritius at the Threshold: The Diagnosis

Public debt 88.3% of GDP. Trade deficit since 1986. Rupee at record low Rs 47.36. Tourist arrivals above 2018 peak but structurally fragile. Offshore sector under OECD pressure. Youth unemployment 17.37%. The full diagnosis, primary data only.

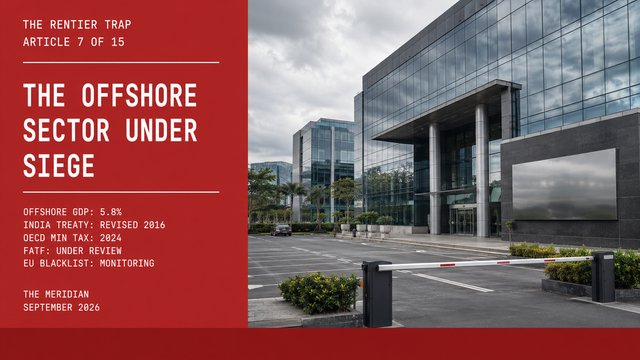
The Offshore Sector Under Siege Mauritius The Meridian September 2026
● NewThe Rentier Trap · Article 7 of 15 · September 2026

The Offshore Sector Under Siege

GDP contribution fell from 8.4% in 2022 to 5.8% in 2023/24. India treaty revised 2016. Substance requirements 2019. FATF grey list 2020, Enhanced Follow-up 2023. OECD Pillar Two 2025. Four structural blows. Two cannot be reversed. The offshore model examined.

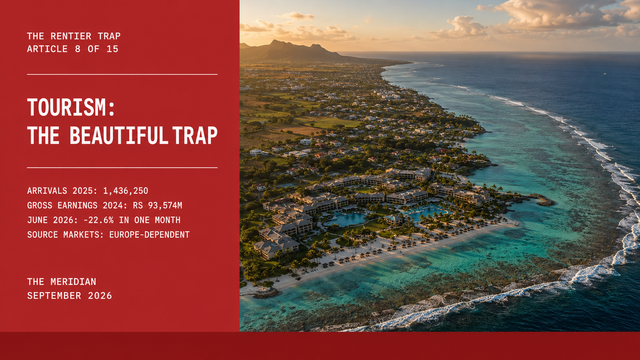
Tourism The Beautiful Trap Mauritius The Meridian September 2026
● NewThe Rentier Trap · Article 8 of 15 · September 2026

Tourism: The Beautiful Trap

Record 1,436,250 arrivals in 2025. Real daily spend EUR 121 vs EUR 139 historical average. France, UK, Germany all declining. June 2026: -8.4% in one month. Dollar costs rising, euro revenues falling. Thirty years of flat real yields.

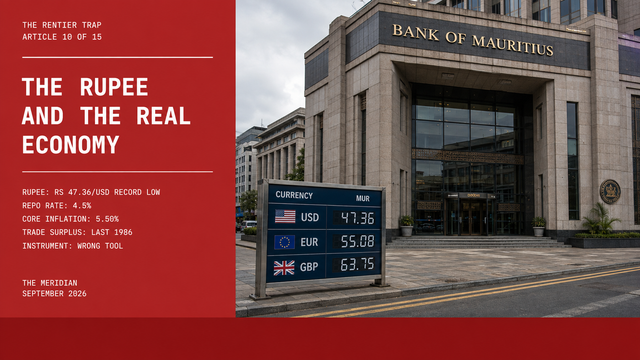
The Rupee and the Real Economy Mauritius The Meridian September 2026
● NewThe Rentier Trap · Article 10 of 15 · September 2026

The Rupee and the Real Economy

Key Rate raised to 4.75% in May 2026, highest since 2013, responding to Strait of Hormuz imported inflation. The instrument suppresses domestic demand. It does not reduce the global oil price. Forty years of trade deficits. The rupee at record low. The monetary bind examined.

The Land Question Mauritius IRS PDS The Meridian September 2026
● NewThe Rentier Trap · Article 11 of 15 · September 2026

The Land Question

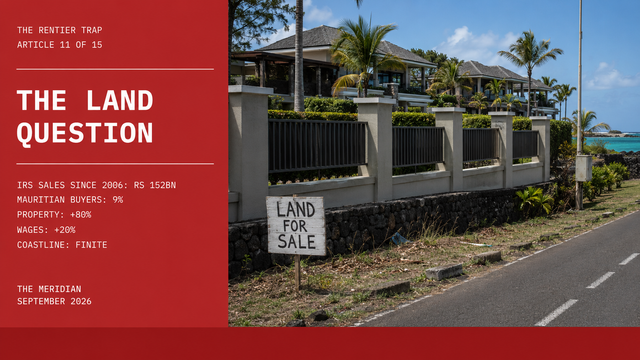
Over 5,000 units sold to non-citizens. Rs 152 billion in foreign real estate since 2006. Mauritian buyers: 9%. Property +80%. Wages +20%. December 2024: 85% rupee rule. July 2026: doubled registration duty. The reforms acknowledge the problem. They cannot undo two decades of accumulation.

The Media Problem Mauritius The Meridian September 2026
● NewThe Rentier Trap · Article 12 of 15 · September 2026

The Media Problem

RSF ranks Mauritius 51st globally. Its weakest indicator: economic, at 49.55. "Highly polarised." ENL and Rogers merged into a single entity in July 2025. The structural conditions that determine what gets covered and what does not. The gap is the evidence.

The Diaspora Dividend Mauritius The Meridian September 2026
● NewThe Rentier Trap · Article 13 of 15 · September 2026

The Diaspora Dividend

3,500 Mauritians leave annually. Remittances at 1.94% of GDP against a world average of 5.13%. The Diaspora Research Funding Scheme had disappointing uptake. Jamaica: 21% of GDP. Cape Verde: 14%. Over $500 million per year left uncollected relative to world average.

The Climate Exposure Mauritius The Meridian September 2026
● NewThe Rentier Trap · Article 14 of 15 · September 2026

The Climate Exposure

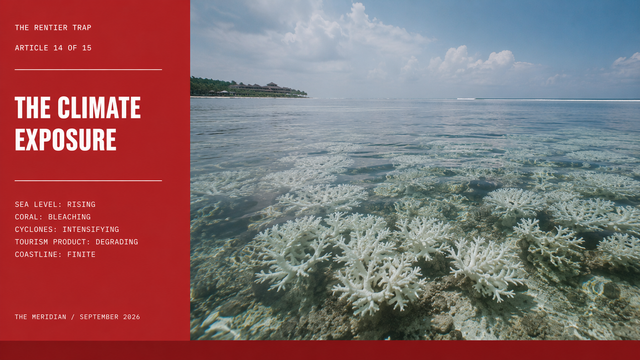
80% of Mauritius corals bleached in March 2025 (MOI Director). NOAA confirmed Mauritius in the 4th global bleaching event. SSTs rising 0.16°C per decade. Sea levels rising 3.8mm per year. The tourism model depends on assets the climate is already degrading.

The Way Out Mauritius Reform Agenda The Meridian September 2026
● NewThe Rentier Trap · Closing Essay · Article 15 of 15 · September 2026

The Way Out

The closing essay. Having documented every structural condition across fourteen articles, the evidence-based reform agenda that the data demands. Not a political programme. What Mauritius needs to do, in what sequence, to escape the rentier trap before offshore contracts and tourism hits its ceiling simultaneously.

The End of Cheap Analytical Essay The Meridian August 2026
● NewAnalytical Essay · Layer V · August 2026

The End of Cheap

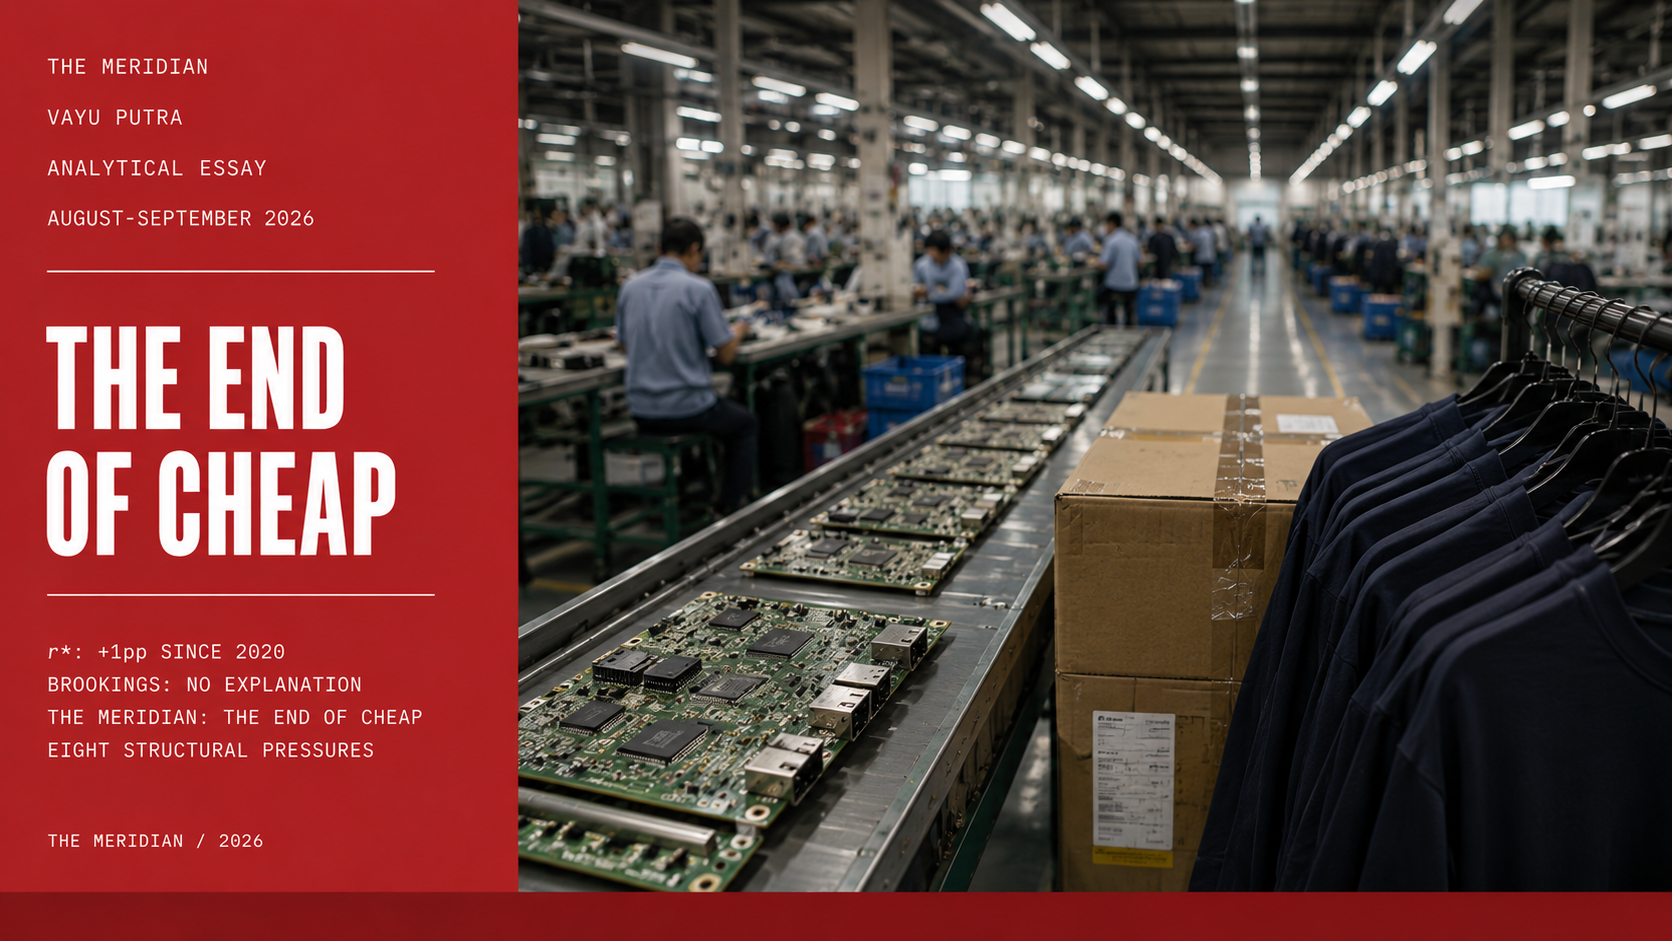
r* has risen one percentage point since 2020. Brookings tested three explanations. None hold. The Meridian has the answer: the structural end of cheap labour arbitrage. Eight simultaneous pressures. A supply-side repricing of global production that no high-frequency event study can find because there is no event to study.

01 / 07
THE STATE OF THE MIND
Human Intelligence Unit
Mind Economy
Indices · Human Intelligence · Fiscal Stress · Youth Opportunity · Public Priorities
Index Watch
HIIMalaysia 69.0 · Saudi Arabia 68.5 · India 65.2 · China 63.2 HPINigeria 10.00 · Ethiopia 9.38 · Indonesia 9.11 · China 8.71 YOSRussia 83.5 · China 78.8 · Pakistan 74.9 · Thailand 71.3 FSIChina 25.5 · Malaysia 30.6 · Philippines 35.3 · Bangladesh 37.6 mind economy indices · alternative economic intelligence · global south comparisons
Mind Economy · Special Data Page

Mind Economy Indices

The Mind Economy Indices provide an alternative reading of economic reality across the Global South. Rather than treating growth alone as proof of progress, they ask whether stability, social investment, youth transition and institutional quality are moving in the same direction.

The framework brings together four composite indicators: the Human Intelligence Index, the Human Priorities Index, the Fiscal Stress Index and the Youth Opportunity Score.

What the Measures Mean

A Simpler Reading of the Four Indices

The Mind Economy framework is built to read economies more like lived systems than abstract machines. Each measure captures a different part of the same question: whether development is producing stability, human priority, resilience and genuine opportunity rather than statistical growth alone.

Human Intelligence Index (HII)

HII asks whether macroeconomic performance is actually coherent. It brings together growth, inflation control, external balance and governance quality to test whether economic management is producing credible order rather than unstable expansion.

Human Priorities Index (HPI)

HPI asks what the budget appears to value. It compares education and health spending to military expenditure, offering a simple reading of whether the state is visibly prioritising human capability over coercive capacity.

Fiscal Stress Index (FSI)

FSI asks how exposed an economy is to pressure. It combines debt, fiscal deficits, external imbalances and reserve weakness into a single vulnerability measure. Unlike the others, lower scores indicate stronger resilience.

Youth Opportunity Score (YOS)

YOS asks whether the next generation can actually enter economic life. It focuses on the transition from schooling into work, measuring whether education systems and labour markets connect in a way that produces real opportunity.

Human Intelligence Index (HII)

A composite measure of macro stability and governance quality. Higher scores indicate stronger alignment between growth performance, inflation control, external balance and institutional effectiveness.

70 60 50 40 30 MYS SAU IND CHN IDN THA 69.0 68.5 65.2 63.2 62.7 62.1 Score
Top readings
🇲🇾 Malaysia
69.0
🇸🇦 Saudi Arabia
68.5
🇮🇳 India
65.2
🇨🇳 China
63.2
🇮🇩 Indonesia
62.7
This is the broadest index in the framework. It asks whether growth is accompanied by enough institutional order and macro discipline to feel credible rather than merely statistical.

Human Priorities Index (HPI)

A social-investment ratio measuring the relationship between education and health spending on one side, and military expenditure on the other. Higher scores imply a stronger formal emphasis on human capability.

10 8 6 4 2 NGA ETH IDN CHN THA VNM 10.00 9.38 9.11 8.71 8.47 8.03 Ratio
Top readings
🇳🇬 Nigeria
10.00
🇪🇹 Ethiopia
9.38
🇮🇩 Indonesia
9.11
🇨🇳 China
8.71
🇹🇭 Thailand
8.47
HPI is not a measure of service quality. It is a sharper question about formal priorities: how much of the budget is visibly tilted toward human capability rather than force.

Fiscal Stress Index (FSI)

A measure of fiscal vulnerability built from debt levels, fiscal balances, reserve cover and external pressures. Lower scores indicate stronger resilience and lower macro-funding stress.

25 35 45 55 65 CHN MYS PHL BGD MEX RUS 25.5 30.6 35.3 37.6 40.0 40.9 Lower is better
Lowest stress
🇨🇳 China
25.5
🇲🇾 Malaysia
30.6
🇵🇭 Philippines
35.3
🇧🇩 Bangladesh
37.6
🇲🇽 Mexico
40.0
Unlike the other indices, lower values are better here. FSI asks how easily an economy could come under pressure if funding conditions or external balances deteriorate.

Youth Opportunity Score (YOS)

A measure of whether education systems and labour markets connect successfully. Higher scores indicate stronger youth absorption into work and lower friction between schooling and employment.

85 75 65 55 45 RUS CHN PAK THA IDN MEX 83.5 78.8 74.9 71.3 70.5 70.2 Score
Top readings
🇷🇺 Russia
83.5
🇨🇳 China
78.8
🇵🇰 Pakistan
74.9
🇹🇭 Thailand
71.3
🇮🇩 Indonesia
70.5
YOS is among the most socially revealing measures in the framework because it tests whether the next generation is actually being integrated into economic life.
Regional Comparison

How the Regions Compare

The regional averages show that the Mind Economy framework is not measuring one thing only. Asia leads on broad macro coherence and youth opportunity, Africa scores more strongly on formal social priority, while Latin America and the Middle East present more mixed combinations of fiscal strain, institutional quality and human outcomes.

Asia

HII
60.6
HPI
6.63
FSI
44.1
YOS
66.2
The strongest overall profile in the sample, combining better macro coherence with stronger youth transition outcomes.

Africa

HII
48.2
HPI
7.72
FSI
57.5
YOS
35.6
Budgets often show stronger formal social priority, but fiscal pressure and weak youth absorption remain major structural constraints.

Latin America

HII
51.6
HPI
6.35
FSI
57.5
YOS
65.3
A mixed regional picture: stronger youth scores than Africa, but fiscal stress remains relatively elevated across the group.

Middle East

HII
49.8
HPI
4.70
FSI
53.9
YOS
56.6
Moderate macro readings and mid-range youth outcomes, but a lower social-priority ratio than the Asian and African averages.
Reading guide
Higher is better for HII, HPI and YOS
Lower is better for FSI
FSI rail is inverted so stronger resilience appears longer
Full Comparison

Complete Country Rankings

The table below brings the four measures together in one place. It should not be read as a final verdict on any economy, but as a structured comparison of how macro credibility, fiscal pressure, public priorities and youth transition interact across the current sample.

Economy HII HPI FSI YOS
🇲🇾 Malaysia69.05.0030.667.6
🇸🇦 Saudi Arabia68.52.7254.857.2
🇮🇳 India65.22.4360.566.1
🇨🇳 China63.28.7125.578.8
🇮🇩 Indonesia62.79.1152.870.5
🇹🇭 Thailand62.18.4753.071.3
🇧🇷 Brazil61.87.2671.761.8
🇰🇪 Kenya61.16.0149.759.5
🇷🇺 Russia59.93.1440.983.5
🇧🇩 Bangladesh58.96.3237.663.8
🇿🇦 South Africa58.85.9468.433.4
🇵🇭 Philippines57.16.5035.344.3
🇻🇳 Vietnam56.88.0346.858.6
🇪🇹 Ethiopia51.49.3854.821.4
🇵🇰 Pakistan50.55.1355.274.9
🇲🇽 Mexico48.57.8440.070.2
🇦🇷 Argentina44.63.9460.863.9
🇪🇬 Egypt36.57.2951.928.4
🇳🇬 Nigeria33.210.0062.535.6
🇹🇷 Turkey31.26.6853.056.1
Rankings combine four different dimensions and should be read comparatively rather than morally. Some economies score strongly on macro order but weakly on social priorities; others show the reverse.
Technical Notes

Data Boundaries and Interpretation

The framework is built from open, comparable annual data rather than proprietary modelling. It is designed to clarify patterns, not erase complexity. These scores should therefore be read as structured signals within a broader editorial architecture.

Sources

Built from open-source datasets, including IMF World Economic Outlook, World Bank indicators, ILOSTAT, UNESCO and governance-quality series.

Benchmark Year

The current release is anchored to the latest broadly comparable annual data set for 2024 across the covered economies.

Interpretation

The indices simplify complex realities. They should be read alongside country analysis, political context and distributional evidence, not as substitutes for them.