The Double Ledger of War: Who Sells, Who Buys, Who Bleeds—and Who Pretends to Save
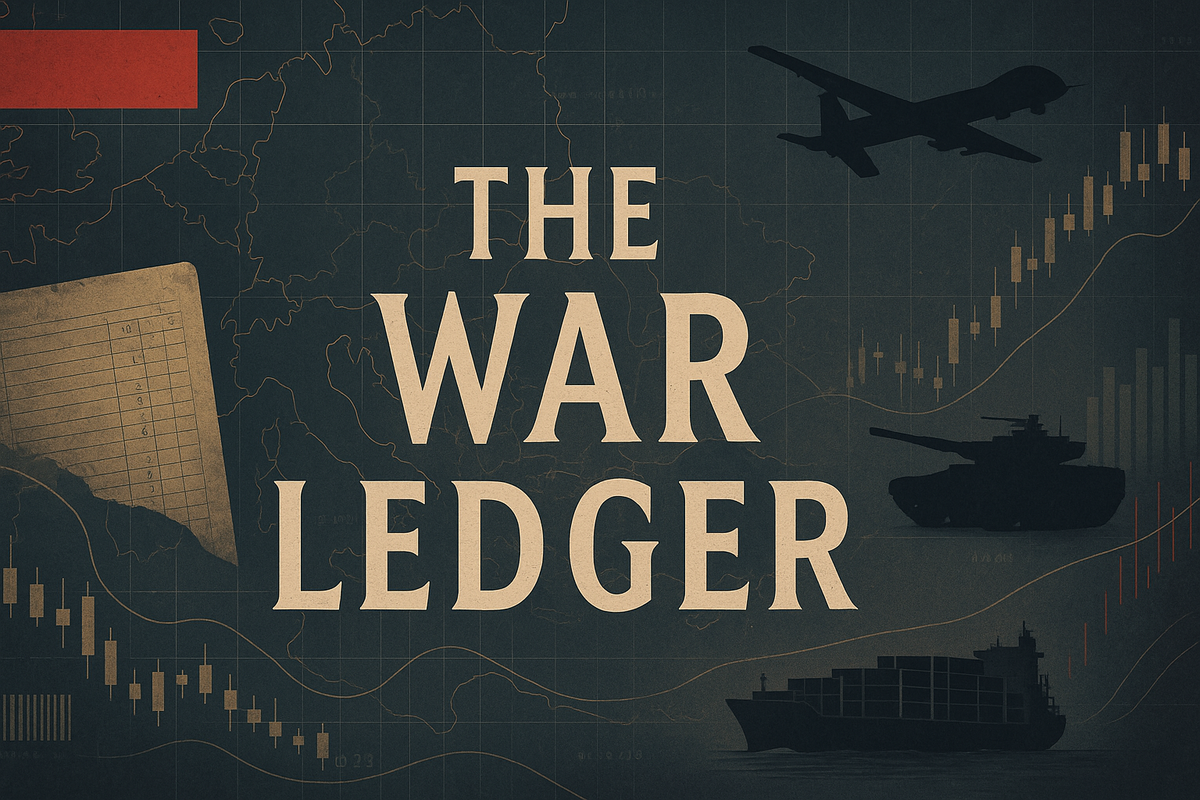
Modern war runs on a double ledger. On one side, states and firms profit from the movement of weapons; on the other, civilians pay in blood, hunger, and lost futures. The apparatus is not hidden behind smoky rooms. It is itemized in procurement schedules, quarterly earnings, and aid pledges; it is narrated on nightly news, minus the connecting lines. This dossier connects those lines. Receipts, not rhetoric.
1) The Accounting of Force
Global military expenditure rose to $2,718 billion in 2024, up 9.4% year-on-year—the steepest jump since consistent post-Cold War tracking began. The military burden reached 2.5% of world GDP, marking a full decade of uninterrupted increases. Those numbers are not abstractions: they are budgets reprioritized from clinics, schools, and food security into missiles, frigates, and data-linked battle networks. When the curve climbs, it rarely falls back to baseline; procurement cycles, industrial backlogs, and the politics of fear ratchet the system upward.
The outlay is concentrated but not narrow. The United States remains in a category of its own, accounting for an outsized share of global spend and underwriting the supply of high-end systems worldwide. China invests heavily in naval power and long-range fires; Russia spends to sustain a war and its industrial base under sanctions; Europe has rearmed at speed since 2022, while India balances modernization with indigenous production. The ledger of force is not only about volumes; it is about time. Once you train pilots, tool factories, and sign multi-year service contracts, your future budgets are spoken for. The world has pre-committed to a more militarized decade.
2) The Exporters’ Map: Sellers East & West
Arms exports turn alliances into 30-year service obligations. Every fighter delivered is a pipeline of training, software loads, spares, mid-life upgrades, and doctrine. In 2020–24, the United States expanded its dominance to 43% of global major arms exports; France rose to second with 9.6%; Russia fell to third at 7.8% as battlefield demand and sanctions pinched; China held 5.9%; Germany reached 5.6%. Behind them, Italy (4.8%), the UK (3.6%), Israel (3.1%), Spain (3.0%), and South Korea (2.2%) filled key niches from drones to artillery, submarines to air defense.
Exports are messaging with material consequences. When Washington ships F-35s to Europe instead of the Middle East for the first time in two decades, that reorients doctrine and supply chains. When Paris inks Rafale packages with India, it ties two bureaucracies together through simulators, weapons stocks, and industrial offsets. When Moscow prioritizes its own front and loses market share, clients diversify. When Ankara sells TB2 drones to dozens of governments, it normalizes remote strike as a mid-tier capability. And when Seoul delivers howitzers at speed, it becomes the stopgap supplier that turns into a long-term partner.
| Rank | Exporter | Share of exports | Change vs 2015–19 | Signature exports |
|---|---|---|---|---|
| 1 | United States | 43% | ▲ +21% | F-35/F-16, Patriot/THAAD, HIMARS, Aegis |
| 2 | France | 9.6% | ▲ +11% | Rafale, Scorpène, Aster/MICA, Caesar |
| 3 | Russia | 7.8% | ▼ −64% | Su-30/35, S-300/400, T-90, Iskander |
| 4 | China | 5.9% | ▼ −5.4% | Wing Loong, HQ-9, Type-054A, JF-17 (w/PK) |
| 5 | Germany | 5.6% | ▼ −2.6% | Leopard 2, MEKO frigates, IRIS-T, PzH2000 |
| 6 | Italy | 4.8% | ▲ +138% | FREMM, M-346, Vulcano munitions |
| 7 | United Kingdom | 3.6% | ▼ −1.4% | Typhoon, Brimstone, CAMM/Sea Viper |
| 8 | Israel | 3.1% | ▼ −2.0% | Iron Dome, Barak, UAV suites |
| 9 | Spain | 3.0% | ▲ +29% | A400M, F-110, Spike (licensed) |
| 10 | South Korea | 2.2% | ▲ +4.9% | K9 howitzer, FA-50, K2 MBT |
3) The Importers’ Archipelago: Who Buys, and Why
Imports are anxiety made material. They are also dependency written into the future: training, doctrine, ammunition calibres, software keys, and the political phone calls that follow. In 2020–24, Ukraine became the world’s largest importer of major arms, reflecting a war-time surge and allied supply pipelines. India remained near the top, hedging against China and Pakistan while slowly increasing domestic content. Qatar consolidated alliances after the blockade shock. Saudi Arabia sustained air dominance and missile defense. Pakistan chased parity from a weaker base, drawing ever tighter to China.
These purchases are rarely one-off. A frigate ties a navy to a supplier’s yards for decades; a fighter ties an air force to a software update cadence and a parts ecosystem. Procurement is foreign policy with a tail.
| Rank* | Importer | Global share | Why they buy | Major suppliers |
|---|---|---|---|---|
| 1 | Ukraine | 8.8% | Survival in full-scale war; coalition logistics | U.S., Germany, Poland, France, UK |
| 2 | India | 8.3% | Deterrence vs China/Pakistan; modernization + “Make in India” offsets | Russia, France, U.S. |
| 3 | Qatar | 6.8% | Alliance insurance after blockade; prestige airpower | France, UK, U.S., Italy |
| 4 | Saudi Arabia | — | Air dominance, layered missile defense | U.S., UK, France, Italy |
| 5 | Pakistan | — | Parity vs India; air & naval modernization | China (dominant), Türkiye |
Special: The Hot Wars and Their Suppliers
Conflicts are sustained by supply lines. Map the fighting against the exporters and the contradiction is obvious: the same capitals that broker ceasefires also book the invoices. This matrix is a snapshot; shipments move, and denials arrive on letterhead. What matters is the pattern—how hardware and doctrine flow into the furnace, and how narratives flow back out, rinsed as “stability.”
| Conflict | Side A (key suppliers) | Side B (key suppliers) | Notable systems |
|---|---|---|---|
| Ukraine–Russia | Ukraine: U.S., Germany, UK, Poland, France | Russia: domestic; Iran (UAV); DPRK (ammo) | Leopard 2, HIMARS, Patriot • Shahed UAV, S-300/400 |
| Israel–Gaza | Israel: U.S. (F-35, JDAM, interceptors); strong domestic industry | Palestinian groups: Iran-linked designs; local fabrication | Iron Dome, JDAM • Qassam/long-range rockets |
| Yemen | Saudi/UAE: U.S., UK, France, Italy | Houthis: Iran (ballistic missiles, UAV) | F-15/Typhoon, PGM • Samad UAV, ballistic missiles |
| Sudan (SAF vs RSF) | SAF: Russia (legacy), Egypt (support) | RSF: alleged UAE channels; Libya routes | Su-25/29, artillery • SALW, technicals |
| Sahel (Mali/BF/Niger) | Juntas: Russia (state/Wagner), Türkiye (TB2) | Insurgents: Libya traffic; captured stocks | TB2, Mi-17, MRAPs • AK-pattern arms |
| Myanmar | Tatmadaw: Russia, China, India | Resistance: smuggled SALW; IEDs | Yak-130, MiG-29, UAVs • improvised devices |
2) The Exporters’ Map: Who Sells Weapons
The trade in major arms is concentrated in a handful of states. From 2019–23, the United States accounted for more than two-fifths of global transfers, France rose rapidly, Russia plunged under sanctions, and China and Germany rounded out the top five.
| Rank | Exporter | Share of exports | Trend vs 2014–18 | Signature exports |
|---|---|---|---|---|
| 1 | United States | 42% | ▲ +17% | F-35/F-16, Patriot, HIMARS |
| 2 | France | 11% | ▲ +47% | Rafale, Scorpène, MICA |
| 3 | Russia | 11% | ▼ −53% | Su-30/35, S-400, T-90 |
| 4 | China | 5% | ≈ Flat | JF-17, Wing Loong, Type-054A |
| 5 | Germany | 5% | ▲ Up | Leopard 2, MEKO, PzH2000 |
3) The Importers’ Archipelago: Who Buys
On the demand side, imports map directly onto insecurity. India buys to hedge against China and Pakistan. The Gulf monarchies buy against Iran. Ukraine buys to survive. Pakistan buys from China to keep pace with India.
| Rank | Importer | Why they buy | Major suppliers |
|---|---|---|---|
| 1 | India | Deterrence vs China/Pakistan; modernization | Russia, France, U.S. |
| 2 | Saudi Arabia | Air dominance vs Iran/Houthi threats | U.S., UK, France |
| 3 | Qatar | Blockade shock; alliance insurance | France, UK, U.S. |
| 4 | Ukraine | Survival; aid-driven flows | U.S., Germany, UK, Poland, France |
| 5 | Pakistan | Parity vs India; modernization | China, U.S. (legacy), Türkiye |
Special Section: Hot Wars & Their Suppliers
Conflicts are supply chains in motion. Ukraine vs Russia, Israel vs Gaza, Yemen, Sudan, the Sahel, Myanmar — all rely on steady pipelines of arms, often from the very states claiming to seek peace.
| Conflict | Side A (suppliers) | Side B (suppliers) | Notable systems |
|---|---|---|---|
| Ukraine–Russia | Ukraine: U.S., EU allies | Russia: domestic, Iran (UAV), DPRK (ammo) | Leopard 2, HIMARS • Shahed UAV |
| Israel–Gaza | Israel: U.S., own industry | Palestinian groups: Iran-linked, local | Iron Dome • Qassam rockets |
| Yemen | Saudi/UAE: U.S., UK, France | Houthis: Iran | F-15/Typhoon • ballistic missiles |
| Sudan | SAF: Russia, Egypt | RSF: alleged UAE, Libya routes | Su-25 • SALW |
| Sahel | Juntas: Russia, Türkiye | Insurgents: Libya traffic | TB2, Mi-17 • AK-pattern arms |
| Myanmar | Tatmadaw: Russia, China, India | Resistance: smuggled SALW | Yak-130, UAVs • IEDs |
4) The Human Ledger
The trade in arms is tallied in dollars. The costs are measured in lives. Conflict deaths surged above 230,000 in 2023, displacement reached 120 million, and humanitarian appeals remain chronically underfunded.
| Indicator | Value | Source | Notes |
|---|---|---|---|
| State-involved conflicts | 61 | UCDP | Record high since WWII |
| Conflict fatalities | ~233,000 | ACLED/UCDP | Scope differs by dataset |
| Forcibly displaced | 120+ million | UNHCR | Refugees + IDPs |
| Humanitarian appeal | $45 billion | OCHA | Chronic underfunding |
| Extreme poverty | ~700 million | World Bank | $2.15/day (2017 PPP) |
4) The Human Ledger: Counting the Cost in Lives
Arguments over strategy and deterrence often skip the part where people die. The human ledger does not. In 2024, conflict-related fatalities jumped to well over two hundred thousand; aid workers were killed in record numbers; displacement reached a new high; and humanitarian appeals remained chronically underfunded. None of these curves is incidental to the sale of arms. They are the downstream effects of choices that are sold as “security.”
Numbers should not dull the senses, but they can focus the mind. The point is not to adjudicate who is “right” in every theater; it is to see the systemic costs that never make it into glossy defense brochures: children who will never go back to school; farmers who will never return to their fields; urban neighborhoods erased into brownfields; aid workers wearing flak jackets to deliver flour.
| Indicator | Value | Source | Notes |
|---|---|---|---|
| State-involved conflicts (2024) | 61 | UCDP | Highest since tracking began in 1946 |
| Conflict fatalities (2024, est.) | ~233,600 | ACLED | Reported deaths across political violence; methodology differs from UCDP |
| People forcibly displaced (end-2024) | 123.2 million | UNHCR | Refugees + asylum seekers + IDPs |
| Aid workers killed (2024) | 383 | OCHA/AWSD | Deadliest year on record; nearly half in Gaza |
| Global humanitarian appeal (2025, req.) | $45.5 billion | OCHA GHO | Consolidated funding needs as of Aug 2025 |
| Extreme poverty (people) | ~700 million | World Bank | $2.15/day (2017 PPP) headcount |
5) The Theater of Helping: From Merchant to Mediator
Here is the double move. First, exporters sell the tools of destruction. Then, under the banner of humanitarianism and diplomacy, they sell themselves as saviours. Contractors announce “community grants” next to plants where missiles are built; governments hold donor conferences while approving the next export license. None of this is a conspiracy in the cinematic sense; it is a set of incentives. Jobs justify exports at home; exports justify leverage abroad; leverage justifies diplomacy; diplomacy justifies aid; aid justifies the idea that nothing fundamental needs to change.
Consider the timeline logic. A fighter jet has a service life of 30–40 years; a guided rocket launcher, at least 15. The humanitarian phases of a war—search and rescue, shelter, food, reconstruction—can last just as long. It is possible, therefore, to profit in parallel from supply and from relief, while claiming the moral high ground on both. The public sees two columns: “defense” and “aid.” The spreadsheet sees one revenue opportunity split into stages.
This is not an argument against humanitarian aid—quite the opposite. It is an argument for honesty. If we believe in humanitarian principles, then let us align them with trade policy and export controls. Let us stop treating civilian protection as a footnote to procurement. And let us stop pretending that the market will navigate these contradictions on its own. It has already told us what it optimizes for.
6) The Information War: Why People Don’t See the System
Wars are not only fought with missiles and tanks. They are fought with words, images, and silences. The information war is what allows exporters to pose as saviours, importers to claim victimhood, and citizens to believe they are merely observers rather than participants. Without control of narrative, the double ledger of war would be obvious.
The silo effect. Defense stories present arms contracts as industrial news, complete with jobs-created talking points. Foreign desks cover bombings and ceasefires as if each were a discrete meteorological event. Humanitarian reporters describe famine and displacement in separate features. Rarely are the three joined. A missile strike is page one; the resupply contract is a brief on page 17. Readers absorb fragments, never the full system.
The political incentive. Governments benefit from this fragmentation. Present arms sales as job creation, and you win votes at home. Present aid as compassion, and you win legitimacy abroad. Present peace talks as diplomacy, and you look indispensable. Keep the three strands separate, and the contradictions never have to meet in a single paragraph.
Propaganda by omission. The most effective propaganda is not a lie—it is omission. Wars are covered when geopolitically convenient; ignored when they are not. Ukraine saturates Western media; Sudan barely registers. Gaza fills headlines during bombardment, then fades during famine.
State and corporate messaging. State broadcasters frame exports as solidarity, reliability, or values. Arms firms emphasize “2,000 jobs secured” rather than “missiles delivered.” The language seeps into coverage. By the time a piece is edited, the information war is half-won.
Erosion of independent reporting. Investigative capacity is expensive and risky. Budgets shrink; correspondents are pulled from danger; press offices and wire copy fill the gap. Secrecy clauses, export-control euphemisms, and official access games ensure that systemic coverage remains rare, while stenography remains common.
Why it matters. If publics saw the ledger clearly—who sells, who buys, who dies—the politics of export would change. The goal of this dossier is not moral theatre; it is accounting. Put the numbers in one frame and the story can no longer be un-seen.
7) Transparency Annex: Receipts, Not Rhetoric
Military expenditure. Stockholm International Peace Research Institute (SIPRI) standardized estimates; constant prices/exchange rates. 2024 total: $2,718 billion (+9.4% y/y); global burden 2.5% of GDP.
Arms transfers. SIPRI Arms Transfers Database (major systems only). 2020–24 exporter shares: U.S. 43%, France 9.6%, Russia 7.8%, China 5.9%, Germany 5.6% (others as listed). Values are trend-indicator, not dollar sales.
Arms-industry revenues. SIPRI Top-100 (2023): $632 billion in arms and military services revenue (real +4.2% vs 2022). Excludes civilian lines.
Conflict deaths. Uppsala Conflict Data Program (UCDP) for state-based counts; Armed Conflict Location & Event Data (ACLED) for broader political-violence estimates. Methodologies differ by design.
Displacement & humanitarian finance. UNHCR Global Trends (end-2024: 123.2 million displaced). OCHA Global Humanitarian Overview 2025 (requirements: $45.5 billion as of August 2025). Aid workers. OCHA/Aid Worker Security Database (2024 fatalities: 383, deadliest on record). Poverty. World Bank poverty headcount at $2.15/day (2017 PPP).
The rule here is plain: where uncertainty exists, we state it; where numbers are revised, we revise with them. War thrives on selective truths. Journalism must not.
| # | Company | Country | Arms revenue |
|---|---|---|---|
| 1 | Lockheed Martin | United States | $62.3 bn |
| 2 | RTX (Raytheon) | United States | $39.7 bn |
| 3 | Northrop Grumman | United States | $32.4 bn |
| 4 | Boeing (Defense) | United States | $29.6 bn |
| 5 | General Dynamics | United States | $28.9 bn |
| 6 | BAE Systems | United Kingdom | $25.5 bn |
| 7 | NORINCO | China | $20.9 bn |
| 8 | AVIC | China | $19.4 bn |
| 9 | Rostec | Russia | $16.6 bn |
| 10 | L3Harris | United States | $16.3 bn |

Add comment
Comments